Analysis of Passenger and Freight Volume at New York Airports (2000-2024)
August 2025 - September 2025
This report analyzes the trends in monthly revenue passenger volume and monthly freight volume at New York's major airports (EWR, JFK, LGA, and SWF) from 2000 to 2024, based on the provided visualizations.
Revenue Passenger Volume:
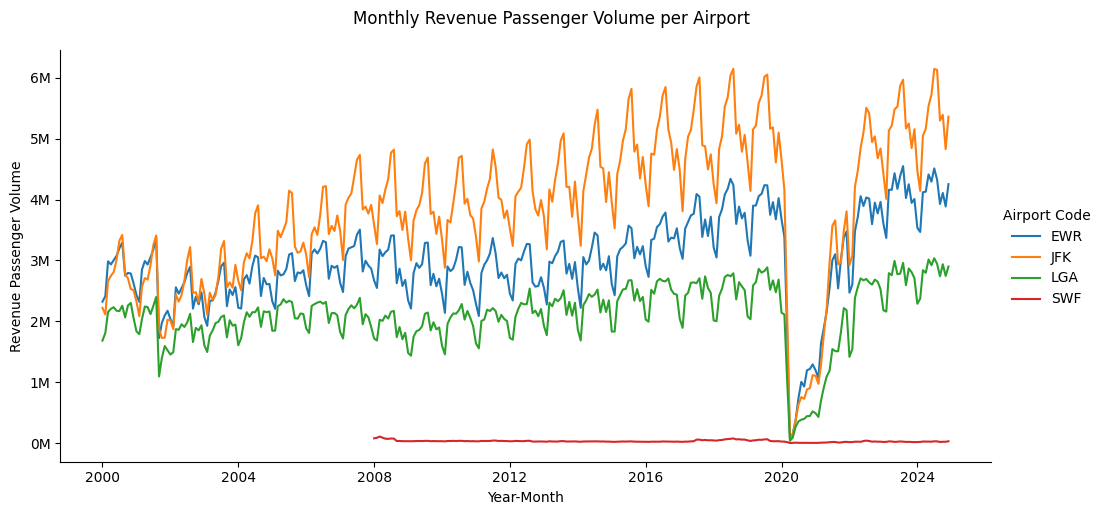
The visualization of monthly revenue passenger volume clearly shows distinct trends for each airport. JFK consistently handles the highest passenger volume, followed by EWR and then LGA. SWF has a significantly lower passenger volume compared to the other three airports.
All airports exhibit a strong seasonal pattern, with passenger volumes peaking during the summer months and decreasing in the winter. A notable observation is the significant drop in passenger volume across all airports starting in early 2020, coinciding with the onset of the COVID-19 pandemic. Passenger volumes have since been recovering, but the recovery rate and current levels vary by airport.
Freight Volume:
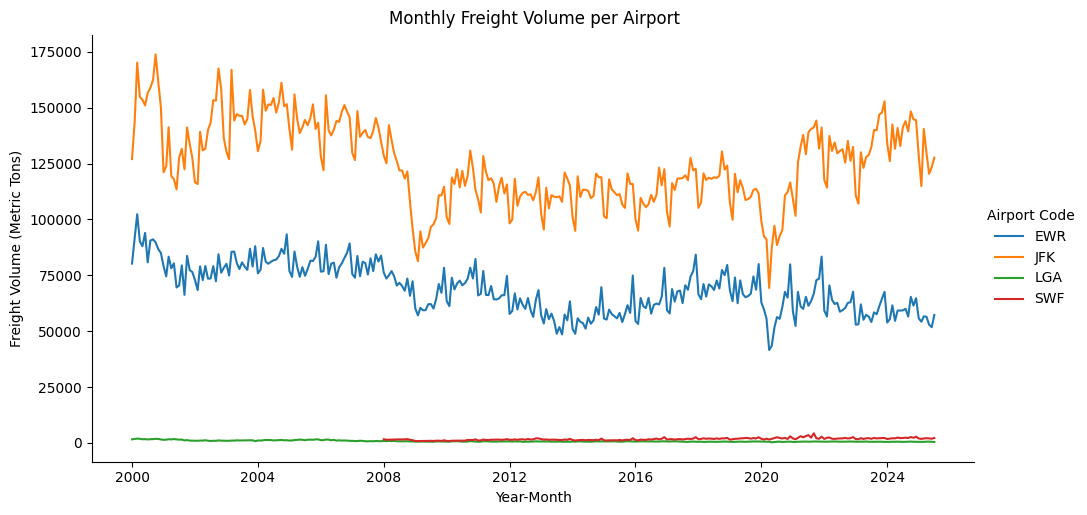
The monthly freight volume visualization reveals different patterns compared to passenger volume. JFK also leads in freight volume, but the gap between JFK and EWR is less pronounced than for passenger volume. LGA and SWF have considerably lower freight volumes.
The seasonal pattern in freight volume appears less pronounced than in passenger volume. The impact of the COVID-19 pandemic on freight volume seems different as well, with some fluctuations but not the drastic and sustained drop seen in passenger volume. Additionally, there appears to be a noticeable decrease in freight volume around 2008 for EWR and JFK, which coincides with the global economic crisis. While this suggests a potential correlation, further analysis would be needed to confirm a direct causal link. This highlights the differing nature of air travel for passengers versus cargo and how economic factors can influence freight.
Meaningful Insights and Implications:
- Dominance of JFK and EWR: Both visualizations underscore the importance of JFK and EWR as major hubs for both passenger and freight traffic in the New York area.
- LGA's Focus: LGA primarily serves passenger traffic, with minimal freight activity.
- SWF's Niche: SWF operates at a much smaller scale for both passenger and freight, likely serving a different market or purpose than the larger airports.
- COVID-19 Impact: The pandemic had a profound and immediate negative impact on passenger travel, while the effect on freight volume was less severe and more varied. This suggests the resilience of air cargo compared to passenger travel during the pandemic.
- Seasonal Trends: The clear seasonality in passenger volume has implications for resource allocation, staffing, and pricing strategies for airlines and airport authorities.
- Economic Sensitivity of Freight: The potential link between the 2008 economic crisis and the drop in freight volume suggests that air cargo can be sensitive to broader economic conditions.
Airline Market Share: 2000 vs. 2024
Examining the market share of airlines in terms of revenue passenger volume provides insight into the competitive landscape and how it has evolved. Let's compare the market share in 2000 and 2024.
Market Share in 2000:
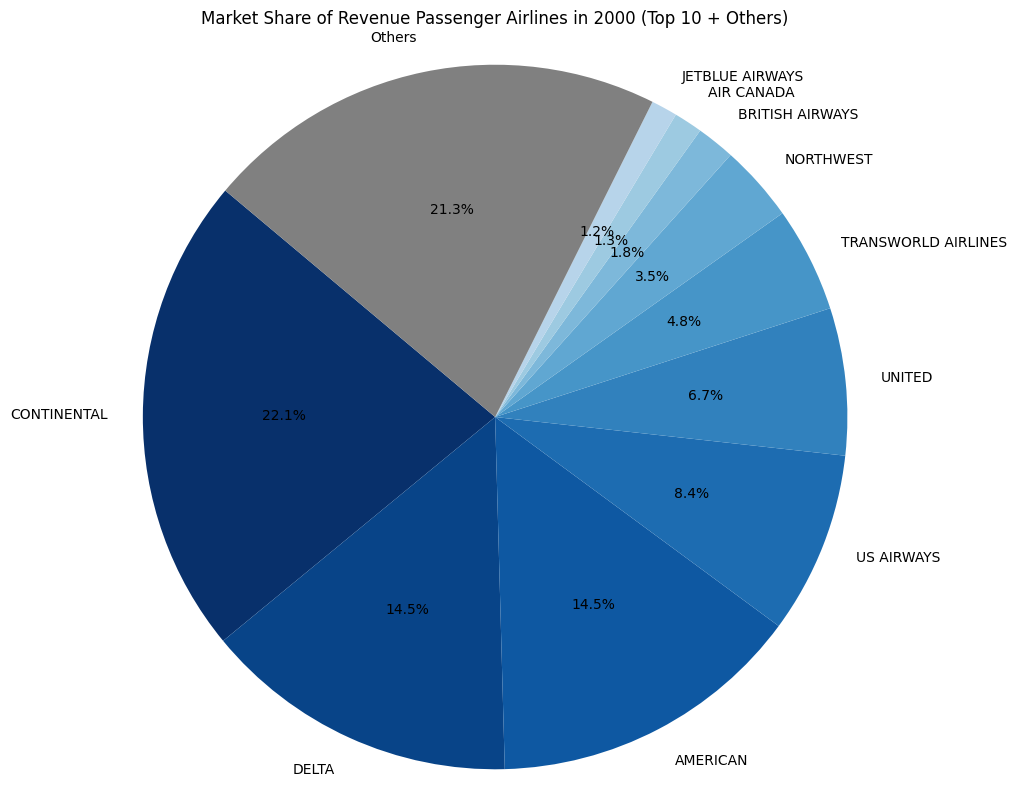
In 2000, the market was dominated by a few major airlines, with a significant portion of the market falling under "Others", representing a fragmented landscape beyond the top players.
Market Share in 2024:
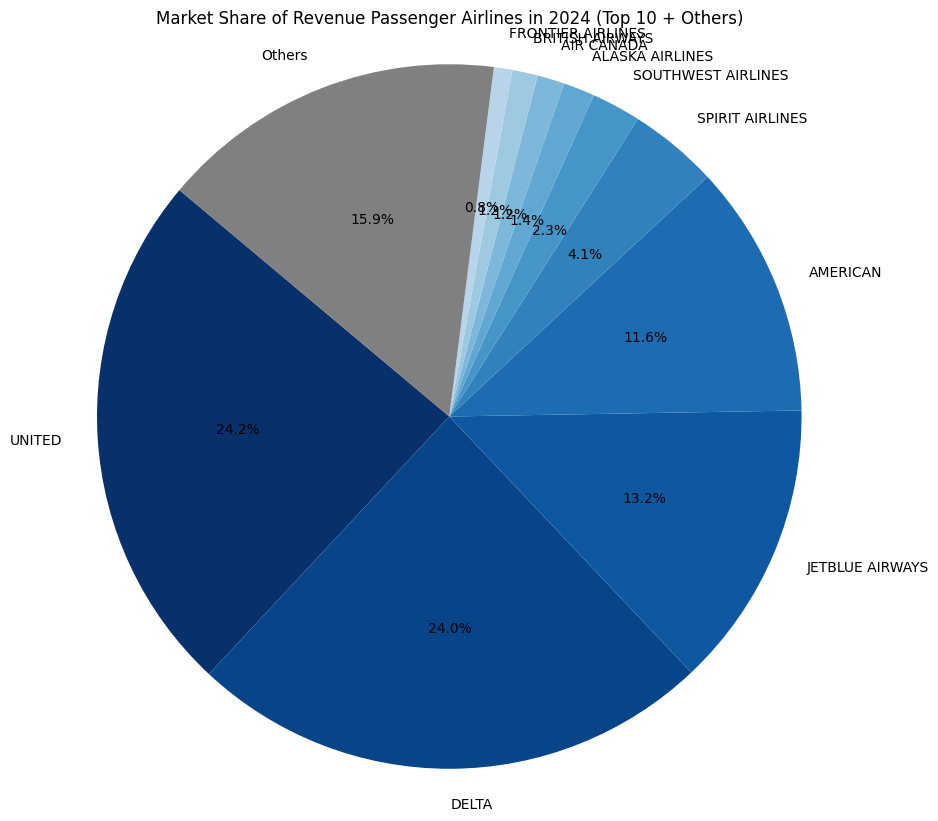
By 2024, while major airlines still hold significant shares, there appears to be some shifts in the distribution. The "Others" category also remains, indicating the presence of numerous smaller carriers or specialized services. A direct comparison of the top airlines in both years would provide more specific insights into which airlines gained or lost market share.
Ethical Considerations:
Analyzing airport data can have ethical considerations related to data privacy, especially if more granular data on individual travel patterns were available. It's important to ensure that data is anonymized and aggregated to protect individual privacy. Additionally, insights gained from this data could inform decisions about airport expansion or resource allocation, which could have environmental and social impacts on surrounding communities. These potential implications should be considered in any decision-making process.
This analysis provides a high-level overview of passenger and freight volume trends. Further analysis could delve into specific routes, airlines, or the impact of other external factors.
Conclusion
The data reveals distinct trends in passenger and freight traffic at New York's airports. Passenger volume shows a strong recovery after a significant pandemic-related dip, while freight volume exhibits a more complex pattern. The airline market share analysis highlights the dynamic nature of the aviation industry. Further analysis could delve into the specific factors driving these trends, the impact of new airlines or routes, and the implications for infrastructure development and airport operations in the future.