Visualization of New York City Airport Traffic using PowerBi
September 2025 - October 2025
Audience & Intent
This PowerBI dashboard is designed for aviation industry stakeholders, including airport authorities, airline executives, urban planners, and policymakers in the New York metropolitan area. The primary intent is to enable data-driven decision-making by revealing long-term trends, seasonal patterns, and the impact of external shocks (particularly COVID-19 and the 2008 financial crisis) on NYC's airport ecosystem.
What I want them to learn:
- How different airports serve different roles (JFK as the primary international hub, EWR as a balanced passenger/freight airport, LGA for domestic traffic, and SWF as a smaller regional airport)
- The profound impact of COVID-19 on aviation and the ongoing recovery trajectory
- Seasonal patterns that can inform resource allocation and staffing decisions
What I want them to feel:
- Confidence in making strategic decisions backed by historical data
- Awareness of the interconnectedness between passenger, freight, and air traffic metrics
What I want them to do:
- Use these insights to optimize operations during peak seasons
- Plan for resilience against future disruptions
- Allocate resources more effectively across the four airports
Story & Structure
The Narrative Arc:
The dashboard tells a story of resilience, disruption, and recovery in NYC's aviation landscape over 24 years (2000-2024). The narrative unfolds in three interconnected chapters:
- Chapter 1 - Passenger Volume: Sets the stage by showing the dominance of JFK, clear seasonal rhythms, and the devastating impact of COVID-19 on human mobility
- Chapter 2 - Freight Volume: Reveals a different story—cargo proved more resilient to COVID-19 but was vulnerable to the 2008 economic crisis, highlighting how economic factors affect logistics differently than leisure travel
- Chapter 3 - Air Traffic Movements: Brings the story together by showing overall airport activity, confirming patterns seen in passenger data and reinforcing JFK and EWR's critical infrastructure roles
Visual Organization:
Each visualization is placed sequentially with contextual narrative between them, guiding the viewer through the data story. The structure follows a comparative-temporal pattern:
- All three charts use the same time period (2000-2024) for consistency
- Color-coded by airport for easy cross-comparison
- Monthly granularity reveals both long-term trends and seasonal variations
- The placement creates a natural flow: people → goods → overall activity
This organization supports the narrative by allowing readers to see how different metrics responded differently to the same external events, particularly highlighting the unique nature of each crisis.
Design Choices
Color Strategy:
- Airport-specific color coding ensures visual consistency across all three dashboards. Each airport maintains the same color throughout, enabling instant recognition and comparison
- Colors chosen for sufficient contrast to distinguish between airports while maintaining readability
- The palette is designed for accessibility, avoiding reliance solely on color to communicate information
Layout & Composition:
- Consistent chart sizing creates visual harmony and makes cross-comparison intuitive
- Time-series line charts were the optimal choice for showing trends over 24 years—they clearly reveal patterns, anomalies, and inflection points
- White space and margins prevent visual clutter, allowing each chart to breathe
- Strategic placement of legends ensures they don't obscure data
Typography & Hierarchy:
- Section headings in 2xl font size create clear visual breaks between narrative sections
- Descriptive paragraph text provides context without overwhelming the visualizations
- The hierarchy guides the eye: Title → Context → Visualization → Interpretation
Clutter Reduction:
- Minimal grid lines keep focus on the data trends rather than the scaffolding
- No unnecessary decorative elements—every visual component serves a purpose
- The dashboard avoids "chart junk" by eliminating 3D effects, excessive borders, or ornamental graphics
Perception & Design Principles Applied:
- Gestalt Principles:
- Similarity: Same-colored lines represent the same airport across all charts
- Continuity: Line charts naturally guide the eye through time progression
- Proximity: Grouping related text with corresponding visualizations
- Pre-attentive Processing:
- Color differences allow viewers to instantly distinguish airports without conscious effort
- The dramatic COVID-19 drop is immediately visible due to the sharp slope change
- Data-Ink Ratio (Tufte's Principle):
- Maximizing the proportion of ink dedicated to displaying data versus decoration
- Every line, label, and axis serves a functional purpose
- Progressive Disclosure:
- Overview metrics first (total volumes), then drill into patterns and insights through the narrative
Reflection
What Worked Well:
- The temporal comparison across 24 years effectively revealed both cyclical patterns and one-time shock events
- The three-metric approach (passenger, freight, air traffic) provided a holistic view of airport operations—showing that while passenger travel collapsed during COVID-19, freight remained more stable
- Color consistency across visualizations made it effortless to track individual airports through the story
- The narrative integration with visualizations created a compelling story rather than just presenting charts in isolation
- Seasonal patterns are immediately visible, which is valuable for operational planning
What Challenged Me:
- Balancing detail with clarity: With 24 years of monthly data across 4 airports, there was a risk of overwhelming viewers. Finding the right level of granularity without losing important patterns required careful consideration
- Distinguishing between correlation and causation: While the 2008 freight dip and COVID-19 passenger drop are visible, communicating that these are correlations requiring further analysis (not definitive causal claims) was important
- Accessibility considerations: Ensuring color-blind users could still interpret the data may have required additional design iterations
- Data normalization: The vastly different scales between SWF and the major airports (JFK, EWR, LGA) could make SWF's trends less visible—deciding whether to use normalized or absolute values presented trade-offs
What I Would Refine Further:
- Interactive filters: Add the ability to toggle airports on/off, zoom into specific time periods, or highlight specific events (9/11, 2008 crisis, COVID-19) with annotations
- Year-over-year comparison views: Create small multiples showing each year as a separate line to make seasonal patterns even more apparent
- Recovery metrics: Add KPIs showing percentage recovery to pre-pandemic levels for each airport
- Economic indicators overlay: Include GDP, oil prices, or tourism data as background context to strengthen the causation narrative
- Predictive elements: Incorporate forecasting to project future trends based on historical patterns
- Mobile responsiveness: Optimize the dashboard layout for viewing on tablets and phones, as stakeholders may need access on-the-go
- Annotations for key events: Visual markers on the timeline highlighting major events (9/11, economic crisis, pandemic start, vaccine rollout) would strengthen the storytelling
Visual Analysis
This report analyzes the trends in monthly revenue passenger volume, monthly freight volume, and air traffic movements at New York's major airports (EWR, JFK, LGA, and SWF) from 2000 to 2024, based on the visualizations below.
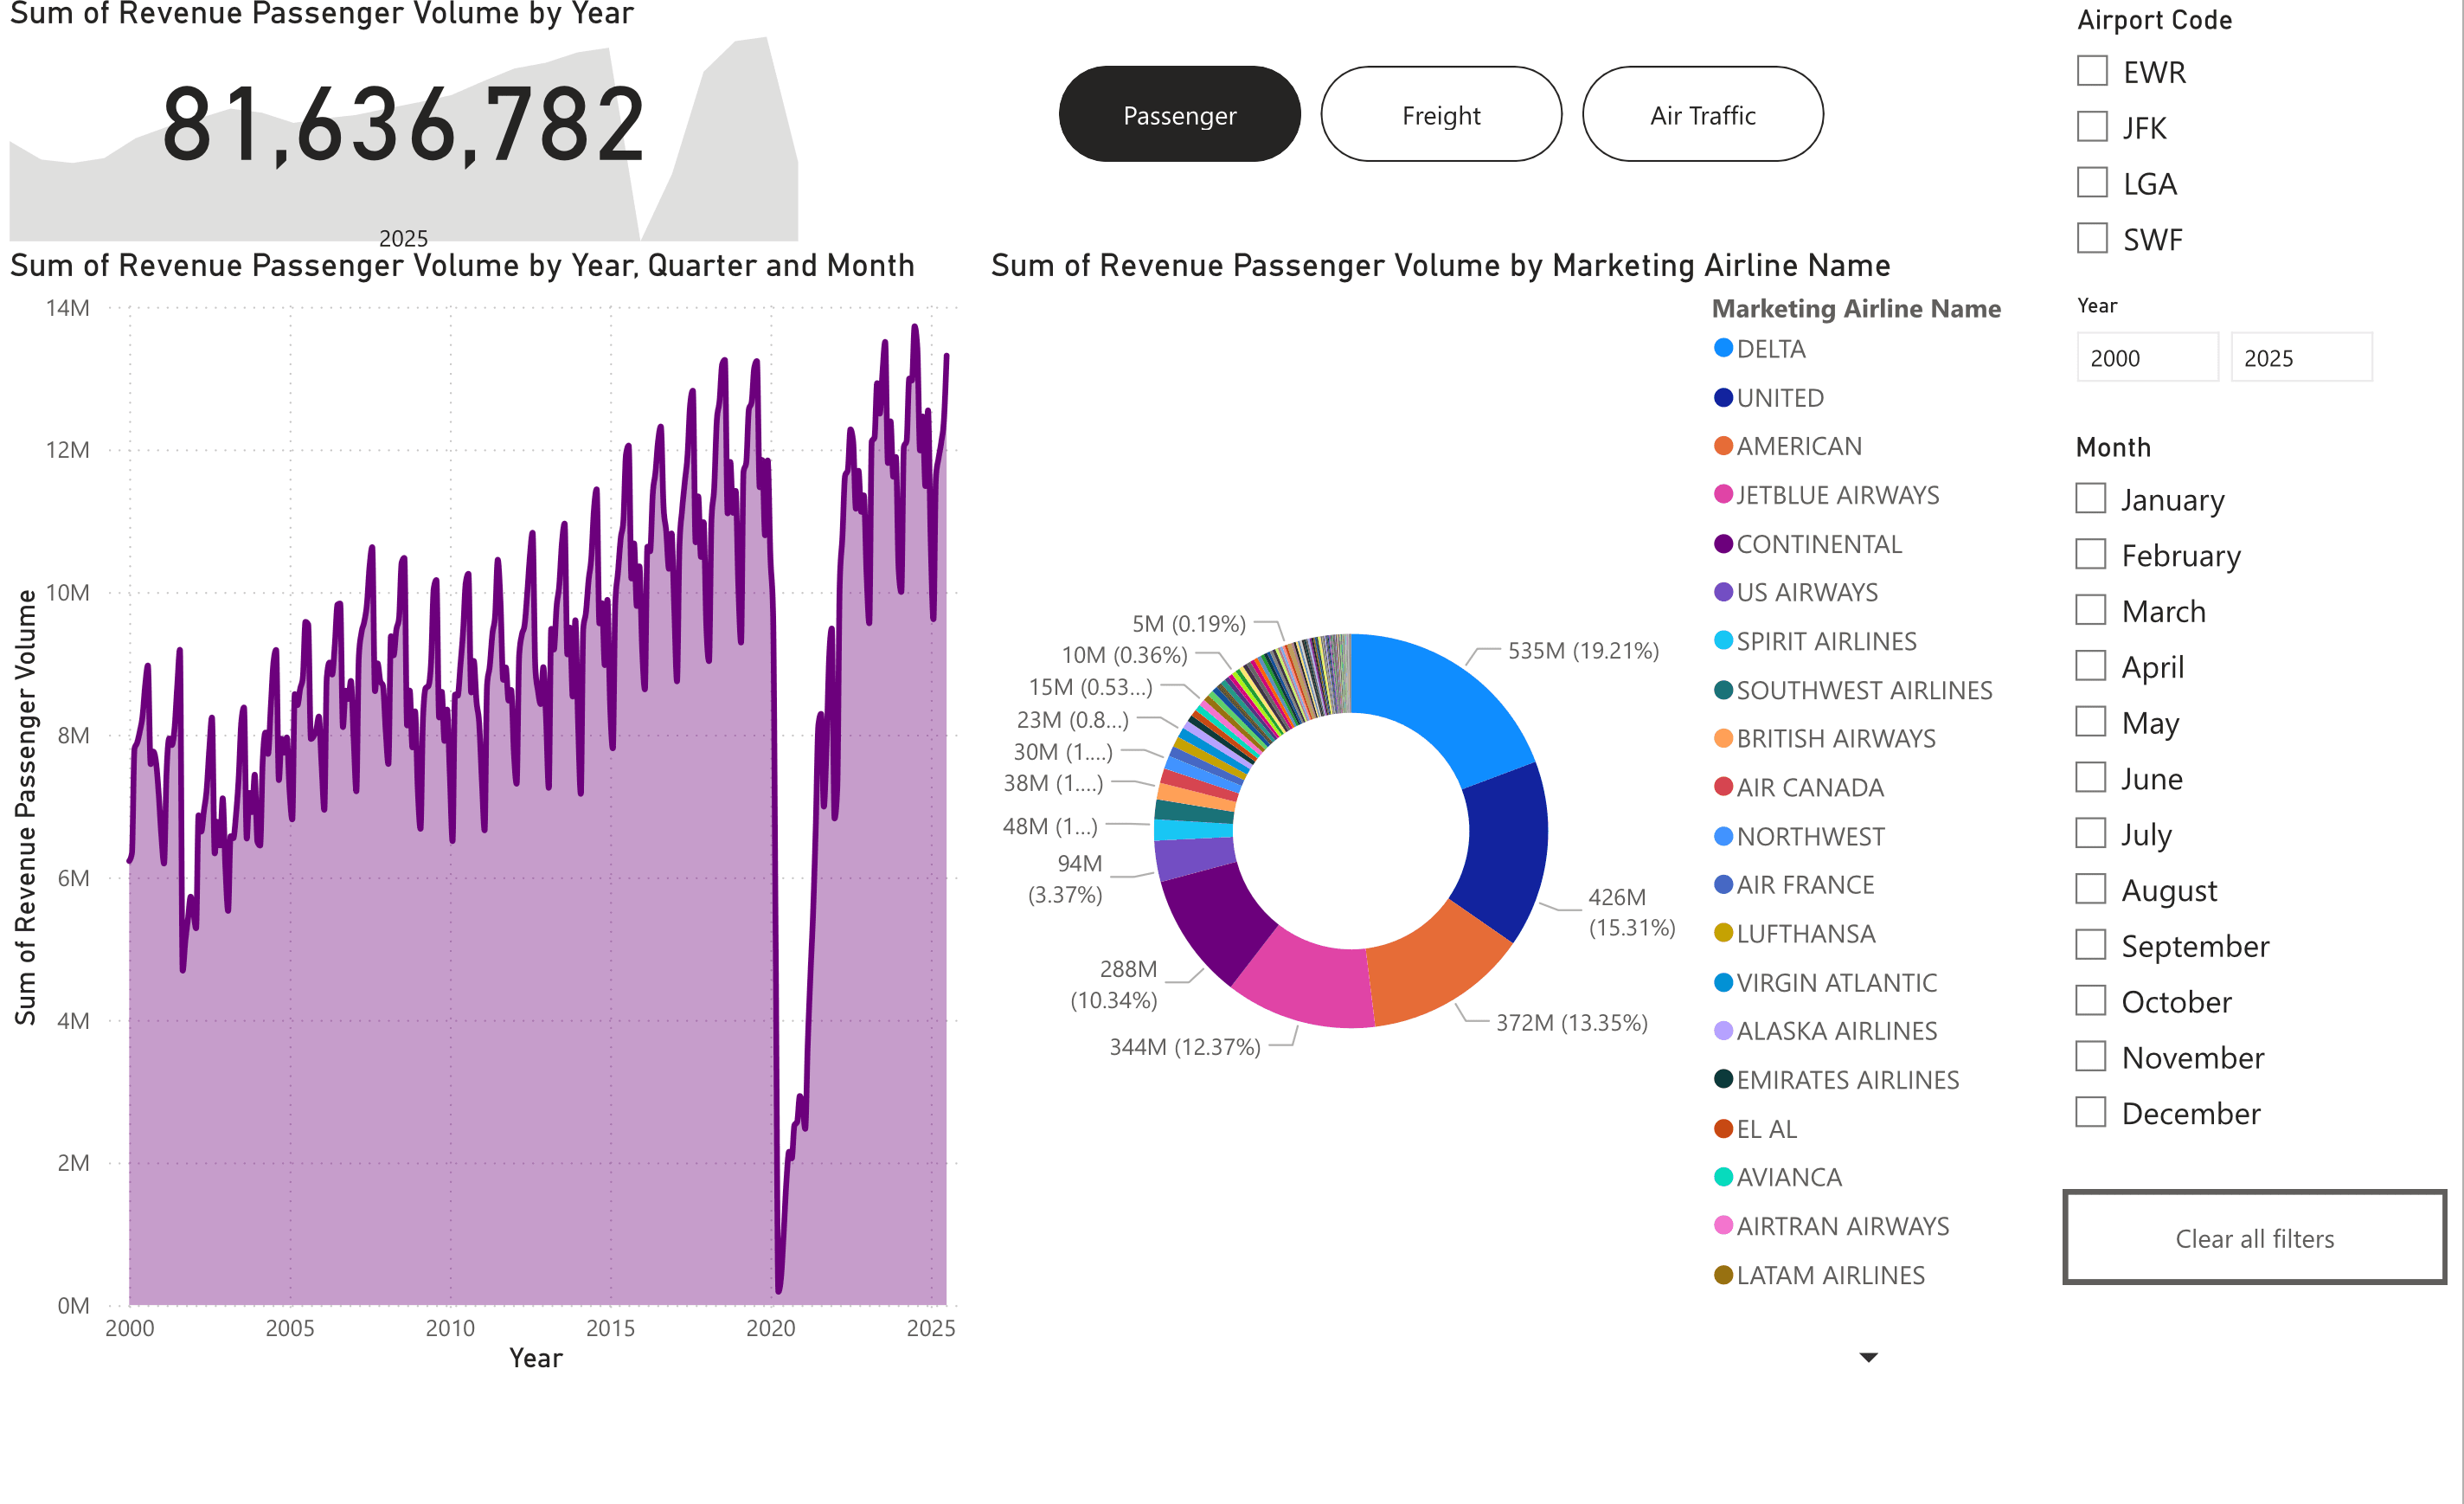
Revenue Passenger Volume:
The visualization of monthly revenue passenger volume clearly shows distinct trends for each airport. JFK consistently handles the highest passenger volume, followed by EWR and then LGA. SWF has a significantly lower passenger volume compared to the other three airports.
All airports exhibit a strong seasonal pattern, with passenger volumes peaking during the summer months and decreasing in the winter. A notable observation is the significant drop in passenger volume across all airports starting in early 2020, coinciding with the onset of the COVID-19 pandemic. Passenger volumes have since been recovering, but the recovery rate and current levels vary by airport.
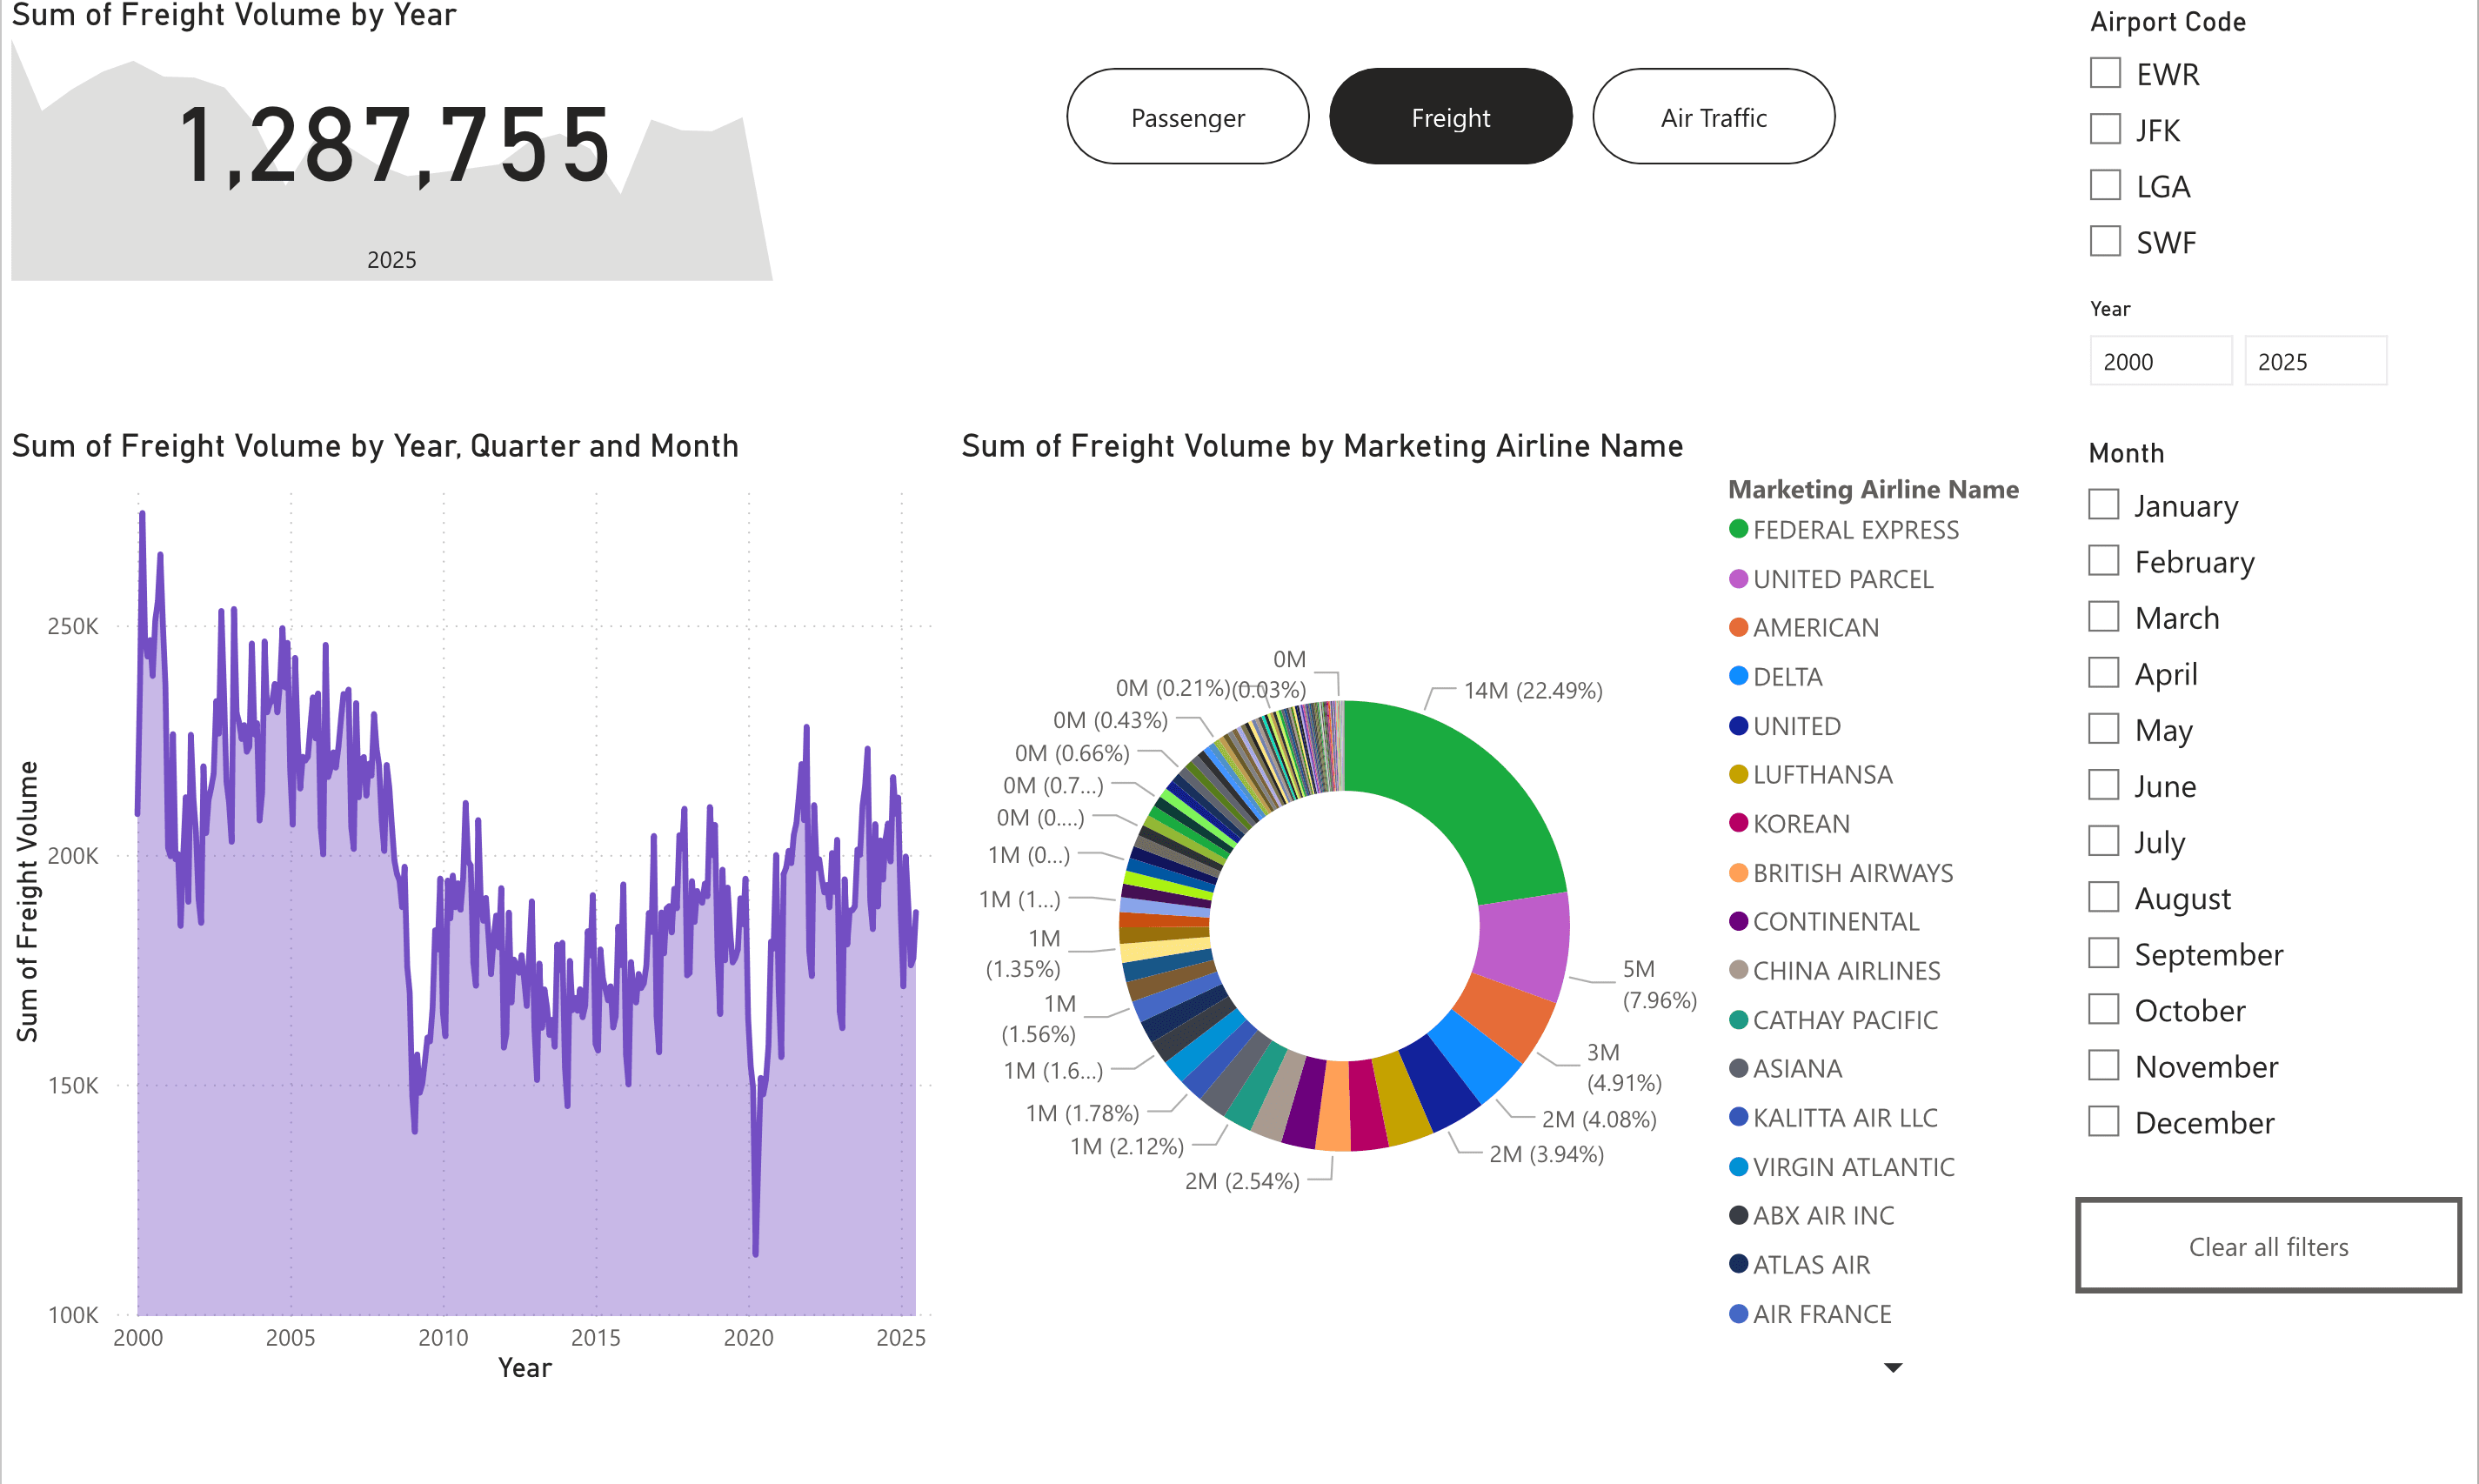
Freight Volume:
The monthly freight volume visualization reveals different patterns compared to passenger volume. JFK also leads in freight volume, but the gap between JFK and EWR is less pronounced than for passenger volume. LGA and SWF have considerably lower freight volumes.
The seasonal pattern in freight volume appears less pronounced than in passenger volume. The impact of the COVID-19 pandemic on freight volume seems different as well, with some fluctuations but not the drastic and sustained drop seen in passenger volume. Additionally, there appears to be a noticeable decrease in freight volume around 2008 for EWR and JFK, which coincides with the global economic crisis. While this suggests a potential correlation, further analysis would be needed to confirm a direct causal link. This highlights the differing nature of air travel for passengers versus cargo and how economic factors can influence freight.
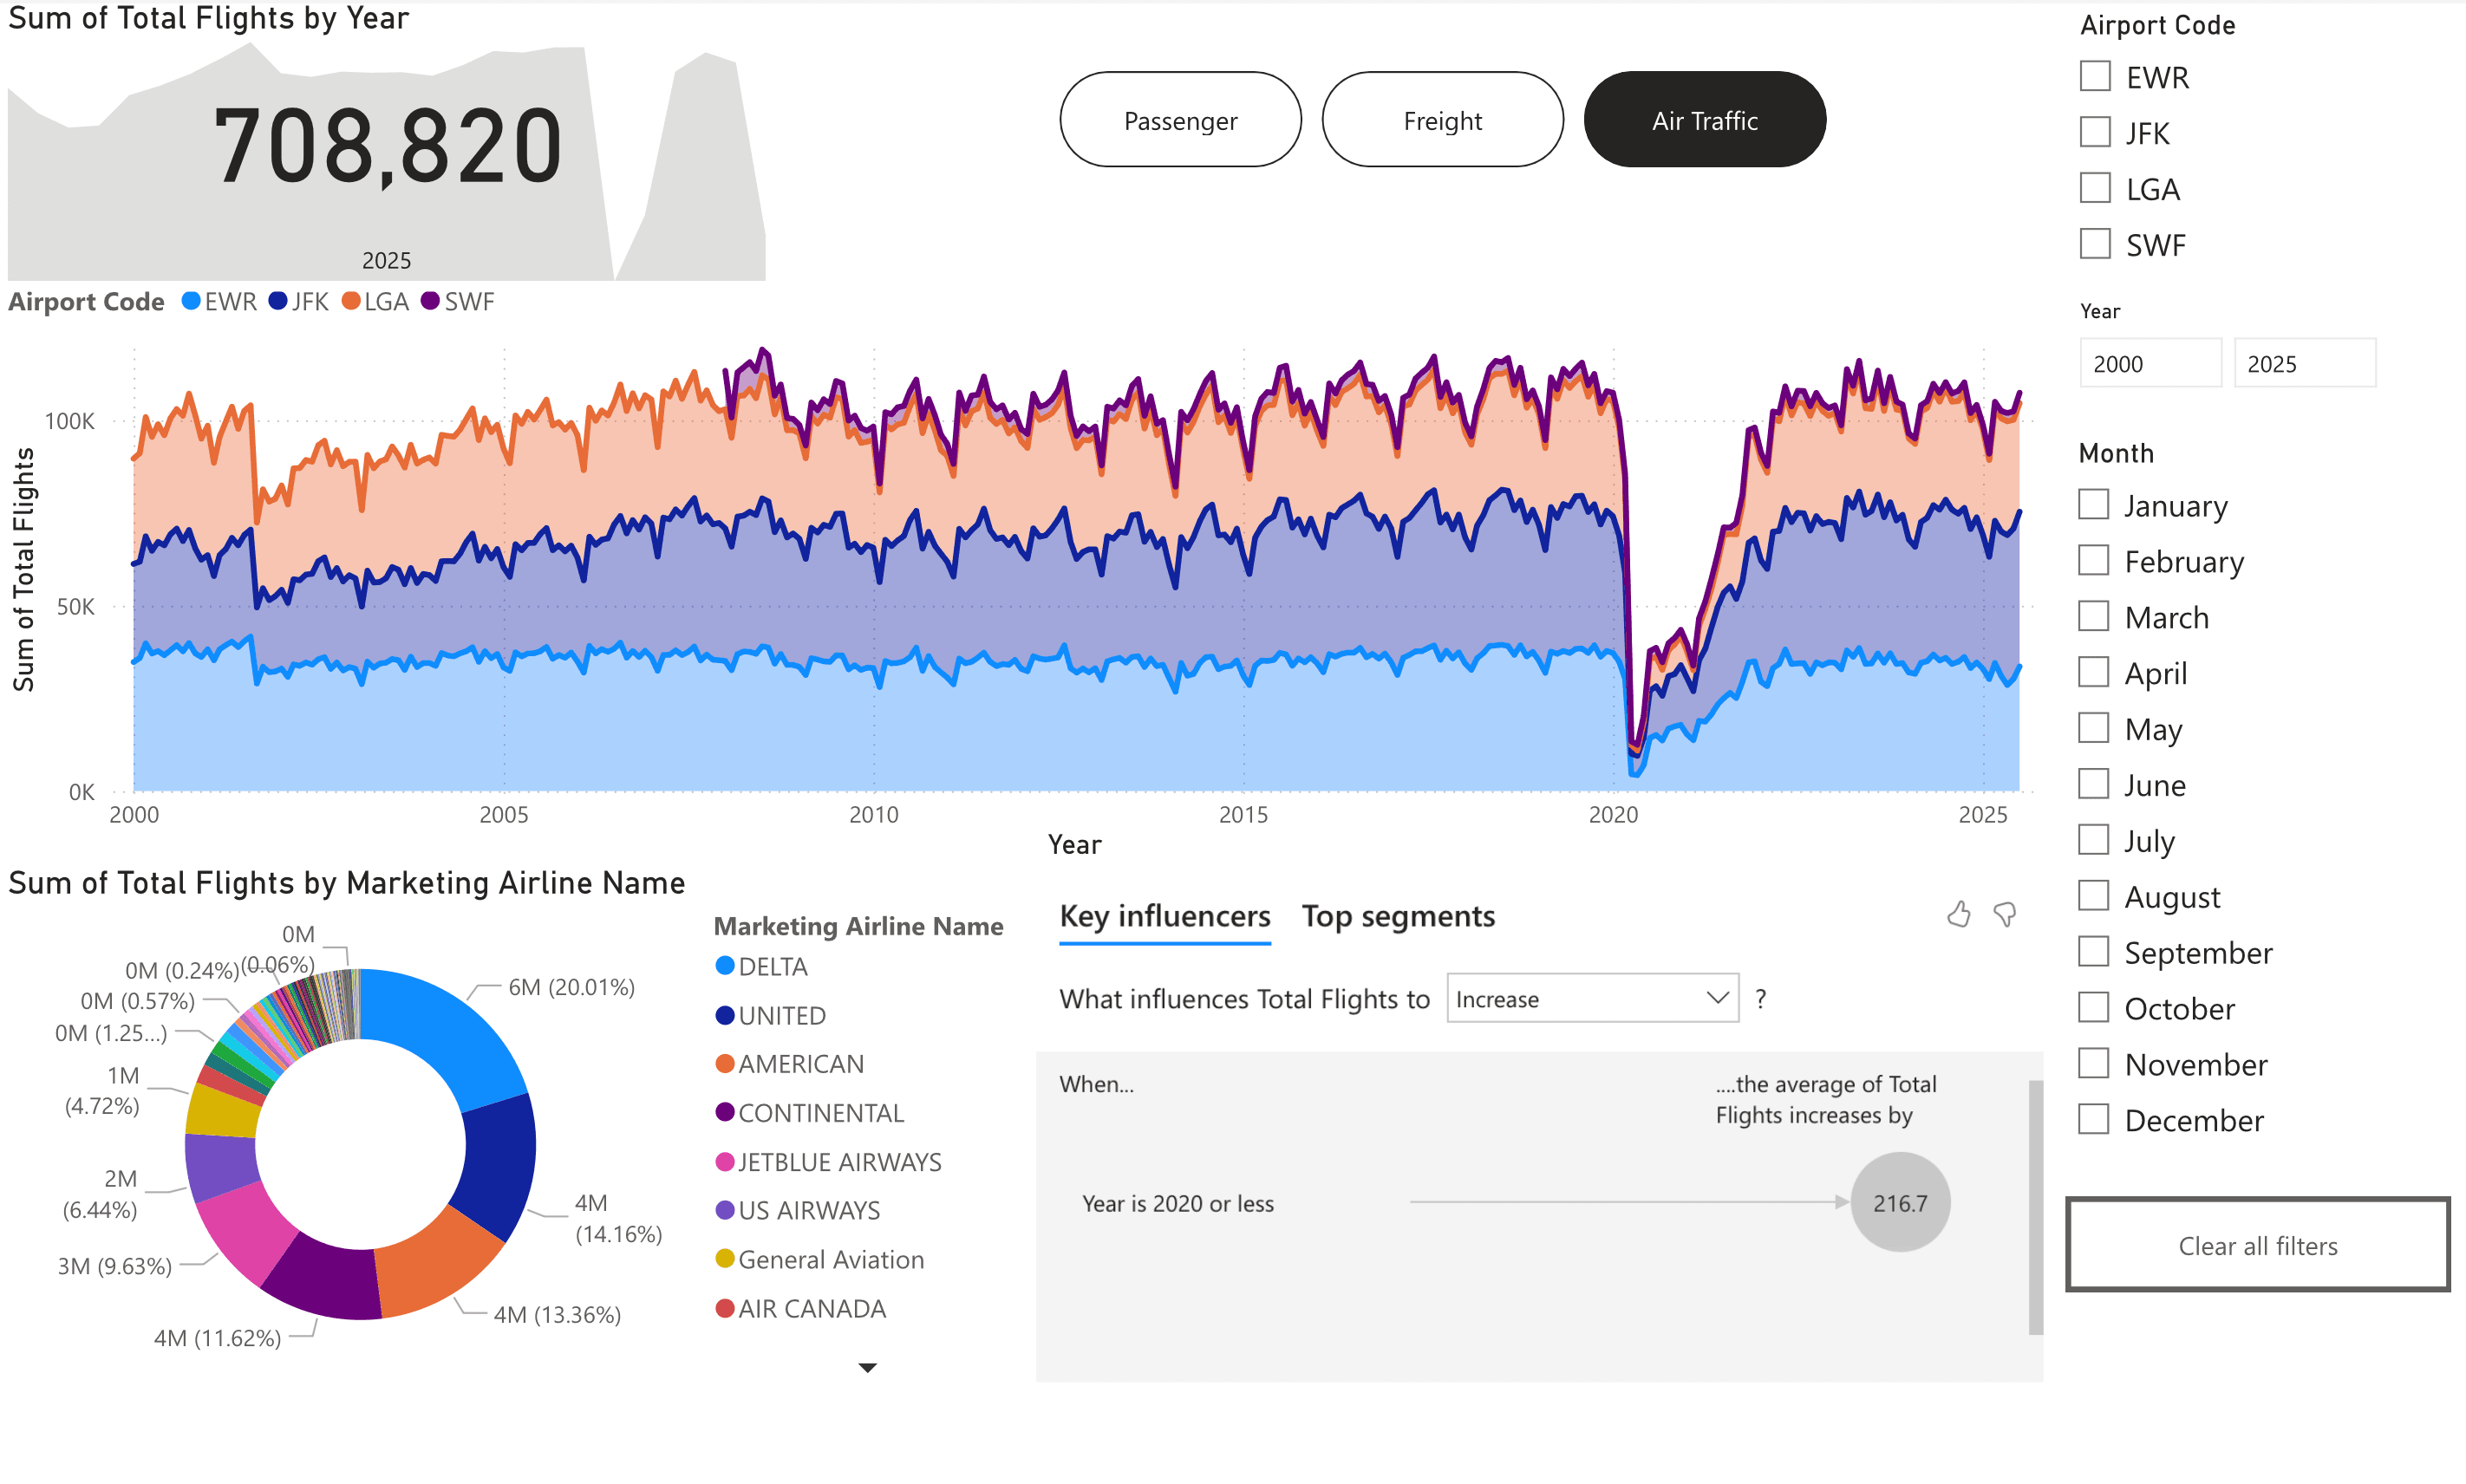
Air Traffic Movements:
The visualization of monthly air traffic movements shows that JFK and EWR handle the majority of air traffic in the New York area, with JFK leading. LGA has a moderate level of air traffic, while SWF has minimal activity.
Similar to passenger volume, there is a significant drop in air traffic movements starting in early 2020 due to the COVID-19 pandemic. The recovery trend is also visible, but the levels have not yet returned to pre-pandemic figures.